I beams and H beams are the most versatile sections which are abundantly used both in structural systems and geotechnical foundations. It is important to understand the bending and shear stresses to understand the response of these under loading and design safe structures.
What did we do?
We loaded our I section beam to 15000 lbs and noted the strains for different rosettes. These rosettes were located at: 1. Three rosettes on the web 2. Three rosettes on the flange
What do I want in the report?
Sample Calculations
- Convert load to newtons (N) please!
- You can do the calculations on paper and attach a photo. Please make sure the photo is clear and the report file size is not more than 5MB.
- Bending moment diagram and shear force diagram for our beam for 15000 lb load (convert to N). Please provide the magnitudes at the ends and middle of the beam.
- Magnitude of bending moment and shear force at the point of strain gages. Use the distance ‘a’ to get this.
- Moment of area (Q) of the section for \textbf{all the strain gage locations}.
- Theoretical Bending/Normal stress at location of Rosette 1 and Rosette 5.
- Theoretical shear stress at location of Rosette 1 and Rosette 5.
- Experimental strains for Rosette 5. Use equations from Lab 2.
- Experimental stresses for Rosette 5. Use Hooke’s law from Lab 2.
- Experimental $\sigma_x$ will be the normal/bending stress.
- Experimental $\tau_{xy}$ will be the shear stress.
Attachments
Tables:
- Attach a table with experimental and theoretical shear and normal/bending stresses along with percentage difference between experiment and theory.
Pictures/Drawings:
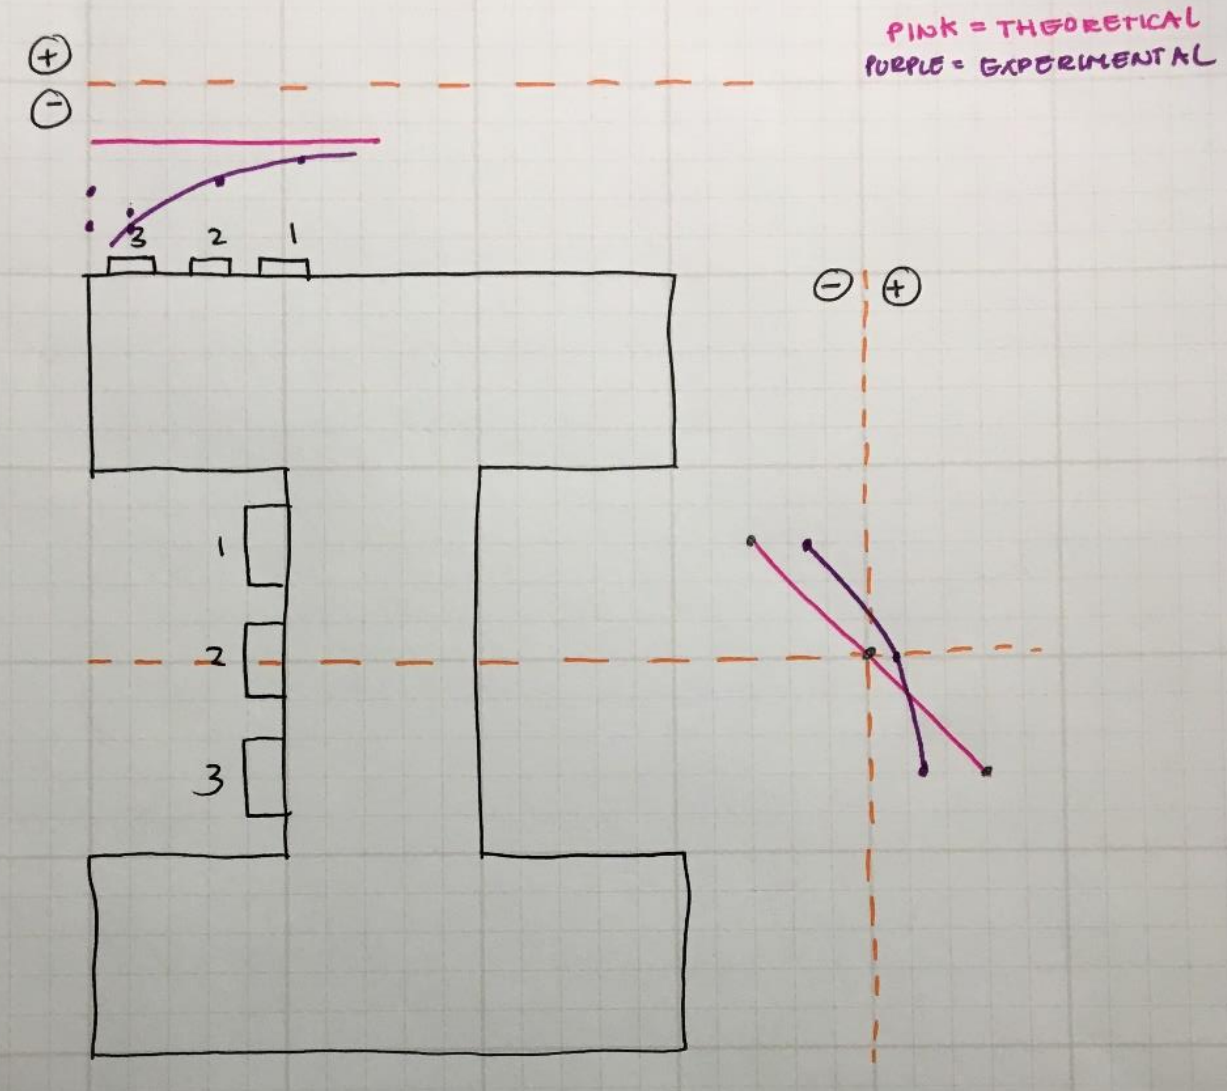
Draw two (2) identical I beam cross-sections. For the loading condition of 15000 lb (convert to N please!):- On the first section, plot the distribution of experimental and theoretical normal/bending stresses.
- On the second section, plot the distribution of experimental and theoretical shear stresses.
This will have the maximum points so please make it clean, concise and put proper magnitudes on all the rosettes.
Clearly show if the plot is linear, parabolic or constant.
Attaching one example: